Well unlike the results from the Eta Aquarids , the Camelopardalids produced a much more convincing peak of activity and at the predicted time!
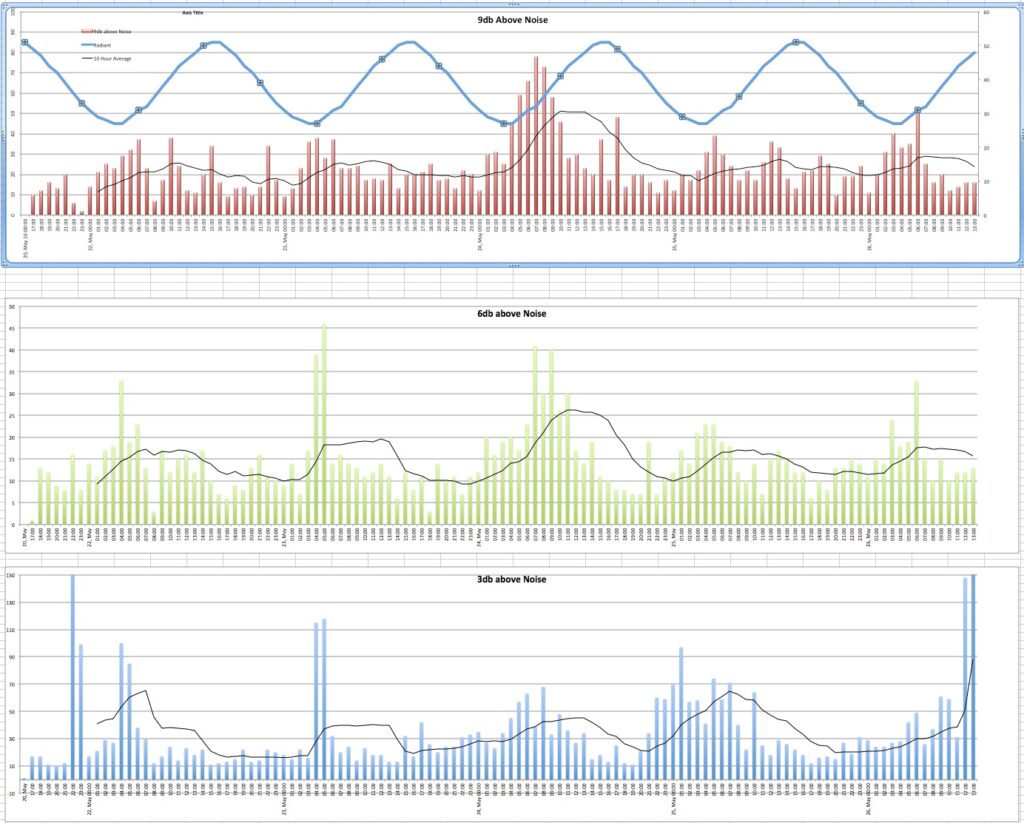
Like my Geminid observations , the ‘9db above noise’ plot, produces a nice peak well above the other days either side. Looking at the 3db plot, there is quite a bit of activity the day after the showers peak on the 24th. I wonder if this indicates a higher density of smaller particles on one side of the main trail of debris from Comet 209P/LINEAR?
I also mentioned in my last post, that it would be interesting to plot the declination of the shower radiant over the time of the observation. To get this data I used the ‘Object Properties vs Time’ tab in Astroplanner. Is chose an SAO star as close to the radiant as I could estimate, and plotted the declination over a 24 hour period to produce the following plot.
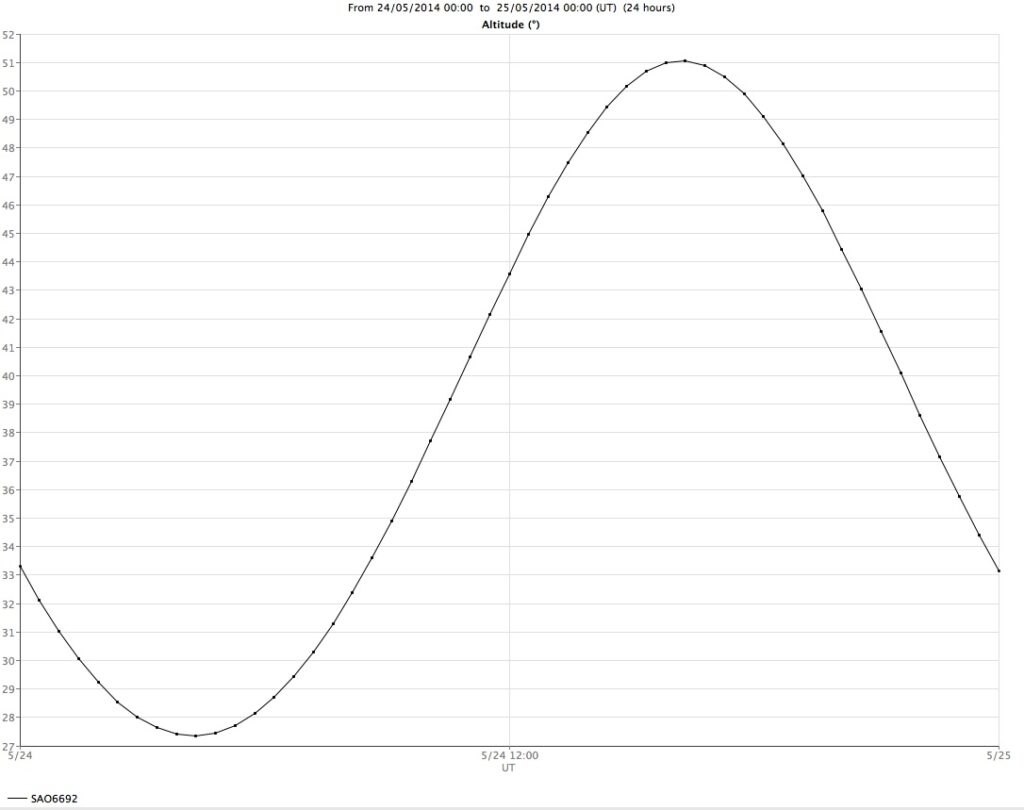
Having done all this, it suddenly dawned that the Camelopardalis radiant never sets and therefore its change is less likely to make as much of a difference than say a radiant that rises and sets. I plotted the data anyway, and sure enough, the time of the greatest declination of the radiant is 8 hours behind the showers peak.
I should apply this to other previous observations and see if I do get a better match.